Purpose:
One of my projects during my bootcamp was predicting housing prices based on a Kaggle dataset of Ames, IA. I assume (unless you’re from Iowa) doesn’t know about Ames, because its small. I actually went to college at Iowa State University, which just happens to be in Ames, or seemingly Ames was located next to Iowa State University. I digress, being such a small town this dataset was limited to only ~1,400 houses, spanning 6 years, and containing about 80 features. When trying to create a good model, one of the hardest obstacles to overcome is not having enough data, and although there is a large number of features to help fit the model, I was still getting a pretty large error.
My hope, is that by adding additional mortgage rate and housing permit data, I’d be able to reduce this error further.
Existing Procedure:
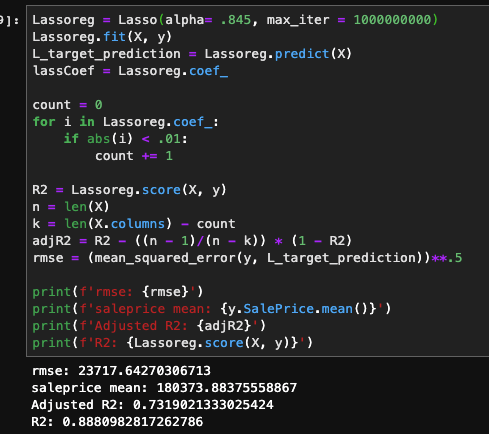
For categorical features, I obtain dummy variables to retain and extract as much information as possible. The resulting number of features, was about 230, and I had a pretty sparse dataframe as a result. For numerical, I applied standardized scaling, and remove outliers beyond 2 standard deviations. As a baseline, I fitted the system with a linear regression model. I had obtained an R2 of .77, but when I looked at the adjusted R2 value it was approximately .55. This led me to utilizing Lasso Regression that would limit the number of non-important features, thus improving the adjusted R2. After optimizing the alpha term, I would improve my results with an R2 of .902 and an adjusted R2 of .76. However, when looking at root mean squared error, I found it to be about $24,016, thus the need for adding extraneous datasets to improve the accuracy.
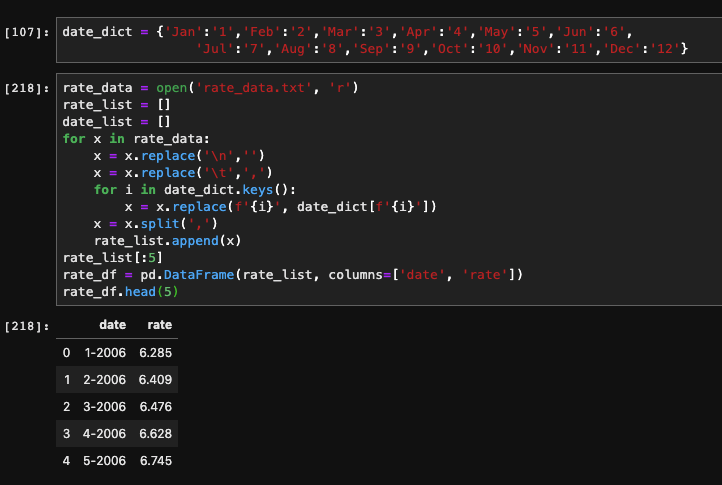
Added dataset #1: Monthly Average Mortgage Rate
The rational behind adding this type of data is simple. The higher the mortgage rate, the more people are going to spend over the lifetime of the loan. When purchasing a residence, the total spent over the lifetime of the loan will be drastically higher for a rate of 7% vs 3%.

As you can see, by adding the additional dataset, the R2 and adjusted R2 hardly move, but there is a significant improvement in the root mean squared error, by about $1,800.
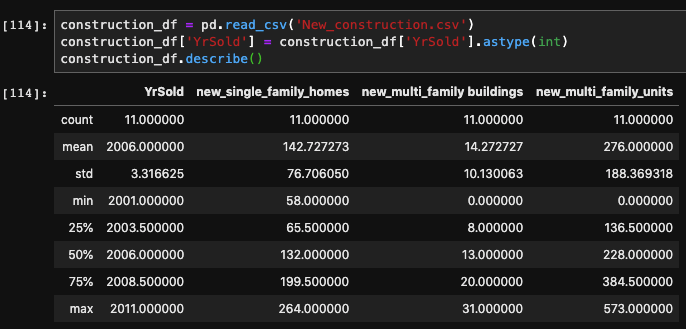
Added dataset #2: Yearly Ames Housing Permits
The addition of this dataset will hopefully improve the accuracy of the model by tracking the supply and demand of housing in the area. The number of permits being issued will provide a good understanding of how additional dwellings will effect the the price, given the increase in supply.
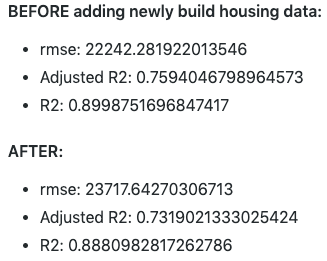
Since the metrics worsen, it appears that this dataset doesn’t improve the predicting power of the model. I believe that this is caused only having yearly data, and maybe if it was more detailed (monthly) that it would provide more forecasting power. I also have my doubts about how influential the issued permits are on the number of residences on the market.
Additional Datasets to be added:
I think more economic indicators, specific to the region, would have some valuable information, such as agricultural prices. I would also like to include the population of the town. This would really help show how the demand for houses fluctuates in relation to demand side of the equation.
