What are Real estate investment trusts?
Real estate investment trust aka, REIT’s, are companies that own/manages real estate. REIT’s are a great alternative to actually buying a physical property. They are required, by law to distribute 90% of their income as dividends and as a direct result they typically have some of the highest dividend yields among publicly traded assets. There is definitly more to know when it comes to REIT’s, but for the purpose of this blog. All you need to know is that REIT have relatively large dividends, and I want to look how this effects the time series decomposition and future projections.
Where did I get the data from?
Alpha Advantage, they have a really easy API to access and whenever I need/want quick, easy, and clean market data its very accessible.
What REIT did I choose?
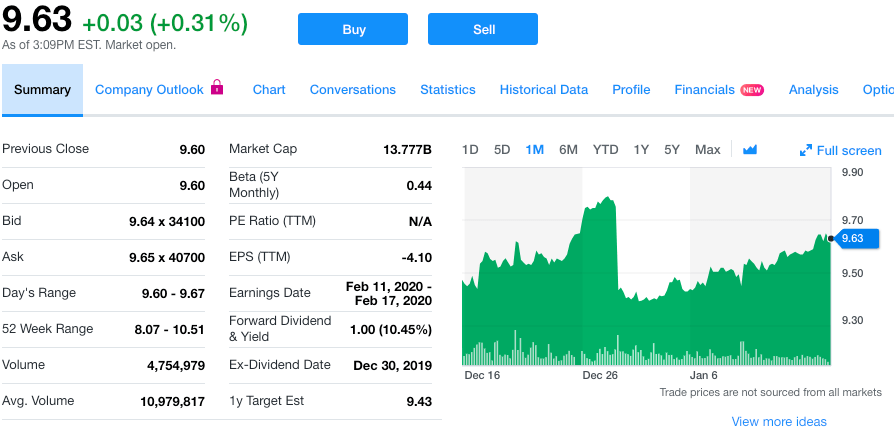
Annaly (NLY), as of 1/15/2019, they are priced at $9.63 per share, and yields a yearly dividend of $1.00, or 10.45% yield, making quarterly distribution of $0.25. I hypothesize that we’ll see significant movement in the seasonality around the dates where investors are locked into each quarter’s dividend payment. This date is also known as the ex-dividend date. This will hopefully allow us to better forecast future result. I selected them because of the significant size of the dividend, and figured it would give me the best chance at seeing any phenomenon, if there is one.
The process
First I started with obtaining the data through an Alpha Advantage API, in JSON format. Next, I proceeded with reformatting the data to capture the average daily move, measured over a month.
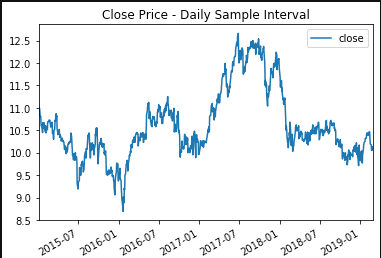
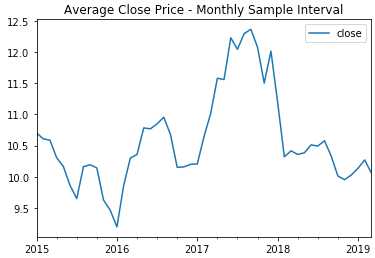
Resampling the data over a month duration, allows us to more easily see the signal, and reduce the residuals. After which, I performed a Dickey-Fuller test to determine whether or not the price history was stationary. Since it was greater than the critical value I was attempting to be under, I needed to perform differencing in an attempt to make distinctions from the data. After re-running the test, I was well below the critical values and could proceed with checking the decomposition plots.

From these plots, I was able to notice a distinct pattern in the seasonality of the pricing that occurred every 12 months. This (and the differencing) are important to note while considering the best SARIMA model. A quick look at the total and partial correlograms showed a couple of the moving average (MA) and auto-regressive (AR) terms that could be considered in the model. However, to figure out the best SARIMA model, I’d have to try a variety of terms and compare the AIC and BIC values for each model. I also tested a 3 month seasonality since I partially expected there to be a strong model reliant on the background expectation that the dividend would cause a drop in stock price every quarter. Turns out, the 12 month model recorded a better AIC. After creating the model, it is then possible to predict future events off of the model.
SARIMAX Parameters
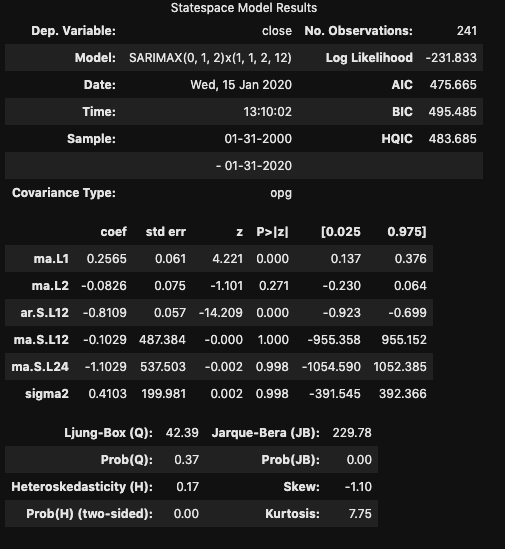
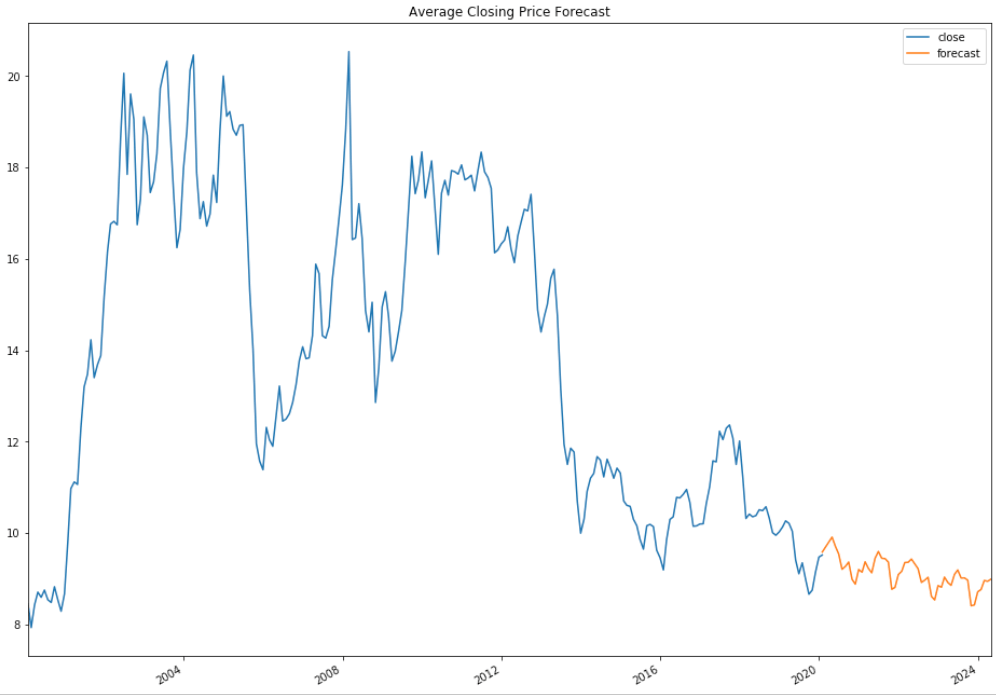
From this model, I was able to generate predictions. One thing to note, the further you get from current data, the less accurate these predictions are going to be. So although my predictions go to 2024, these are highly based off of previous prediction values, and will vary significantly
Conclusion
Time Series modeling can provide a crude look ahead at future values. While ‘closing price’ is reliant on the previous day’s value, it is only a fractional piece of data. Trying to create a stock prediction model of a single feature will not yield accurate predictions.
In regards to the dividend, while it is evident that these distributions effect the price of the stock, it is significantly less important than prevailing trend of the stock.
Disclaimer
It should be understood there is no guarantee that past performance will be indicative of future results. Investors are cautioned that they may lose all or a portion of their investment when trading or investing in stocks and options.
