IPywidgets – Interactive Visuals in MatPlotLib
Why I wanted to learn a new library
Through the Flatiron school program, it’s typical that new libraries get introduced either in lecture or on Learn.co. However, this style of “spoon-feeding” new information is atypical in the real world, and in this career path, I’ve subscribed to life-long commitment of academia. This blog will follow the path I took, in learning IPywidgets, an interactive graphing library built on top of MatPlotLib.
The Approach and Confronting Challenges
I knew that I wanted to tackle a new visual library that expanded what I already learned, but I didn’t know which particular area. This predicament led me to the internet. After a few dead-ends, I found IPywidgets.
Why choose IPywidgets? Because its interactive! Instead of cramming too much data onto a single plot, or spreading it across a sea of plots and colors, we can allow the viewer to control what they see, and add value to almost any project.
Before jumping in and attempting to code, I looked at a few YouTube videos that walked through the basics, and outlined some of the features. I quickly learned that there was a plethora of widgets available that could be used to manipulate the code, in one form or another. The link below includes the current list of widgets available.
https://ipywidgets.readthedocs.io/en/latest/examples/Widget%20List.html
The one tool that stood, out was a slider widget. It could be moved to change variables and, as a result, drastically change the outcome of your graph. This seemed useful and practical, so I decided to attack this feature specifically.
The Premise
In its essence, each slider widget changes a single variable in a function that modifies the output of a graph through the “widgets.interactive” method. This method passes the function to be applied to the plot as well as linking the slider items and the variables in the function.
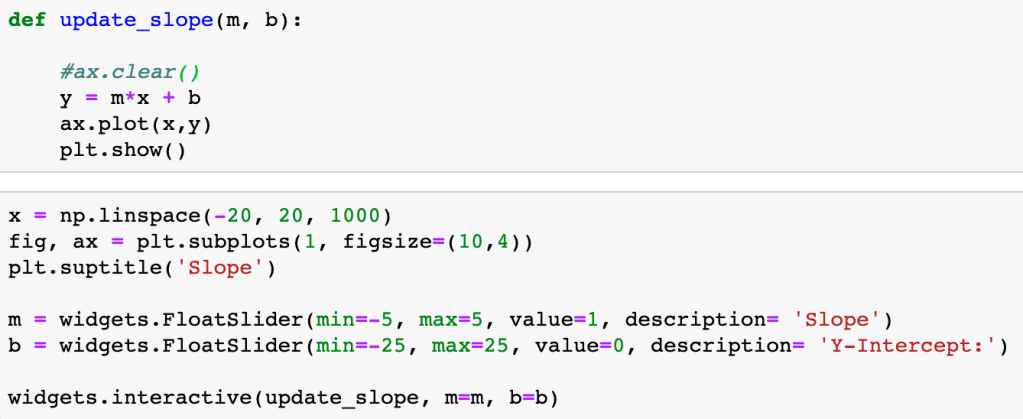
One of the easiest ways to see this in action is through a simple linear function defined by:
y = mx + b
To modify the line, we’d alter the slope, ‘m’ and y-intercept, ‘b’. When doing so, the interactive widget considers the change to the function, and re-plots on top of the existing. Ax.clear() removes the previous plot. If we forget to clear the existing plot, the interactive widget will continue to plot on top of the previous iteration. The result can be colorful and artistic, but more likely distracting and not advisable.
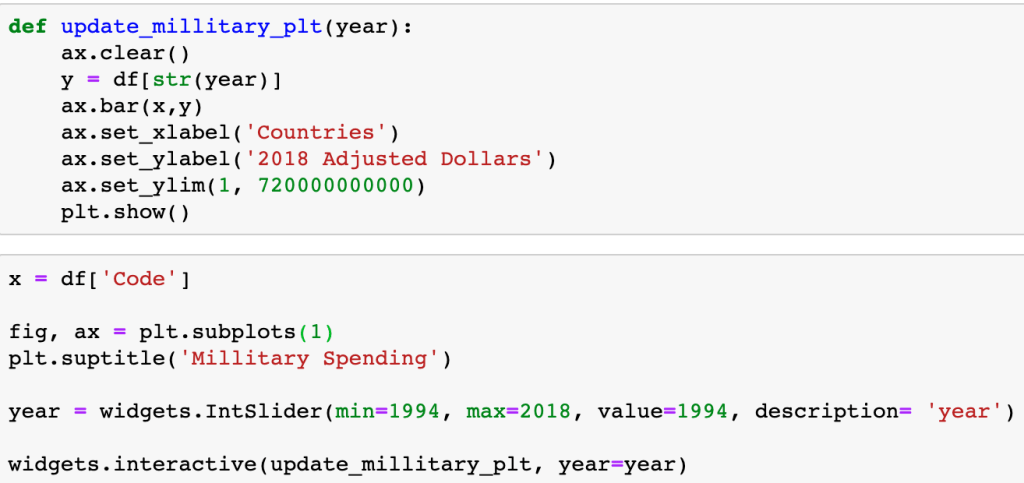
When accessing a Pandas Dataframe, you have to either setup the function to iterate through the table or, in this specific case, iterate through the table through the column header.
Leaning on the documentation
There are countless amount of variations in what you could possibly want in a graph, and there is no YouTube Tutorial that is going to help you through your exact error or issue. Being able to lean on the documentation is essential to learning new libraries. For example, I ran into an issue using widgets in Jupyter Labs. I originally thought the issue was syntax related, but the online documentation validated what I had. This permitted me to pursue other troubleshooting issues. Simply switching to a Jupyter Notebook resolved the issue. Since my primary purpose of this blog is to focus on the library and the learning process, I continued on a Notebook.
Another Example With Legend
In the example below, I define a sine function with a dampening coefficient (1/(x+.1)). The function includes a legend, that will update as each plot gets created and removed.


Conclusion
Interactive widgets are relatively easy to use, after a little practice. Visuals are easily interpreted by many, and often bridge knowledge gaps. Interactive graphs provide hands-on instantaneous data exploration, even to those with no data science background, and are a resourceful tool for any aspiring Data Scientist.
